Linux Process Management
- Siddhesh Kadam

- Dec 7, 2023
- 6 min read

Linux process management involves various commands and utilities to control and monitor processes running on a Linux system. In this blog, we'll delve deep into Linux process management and understand its core concepts. Type Of Linux Process :
1. Foreground Process. A foreground process in Linux is a process that is currently running in the foreground of a shell session, and it directly interacts with the user. When a command is executed in a terminal without explicitly being sent to the background, it runs as a foreground process. Foreground Process FlowChart :
2. Background Process. A background process is a process that runs independently of the terminal or shell that started it. Unlike foreground processes, background processes do not block the terminal, allowing users to enter additional commands without waiting for the process to complete.
Background Process FlowChart :
Type Of Linux Process Stat :

Linux Process Management Through ps :
The ps command in Linux is a versatile tool for viewing information about processes. It provides a snapshot of the current processes running on the system. Here are some commonly used options with the ps command:
1.Display Information for All Processes.
[root@siddhesh ~]# ps auxDisplays detailed information about all processes in a user-oriented format.
2. Display Process Tree:
[root@siddhesh ~]# ps auxfShows a tree structure of processes, indicating parent-child relationships.
3. Display Specific Process by PID:
[root@siddhesh ~]# ps -p 1Displays information about a specific process identified by its Process ID (PID).
4. Display User-Specific Processes:
[root@siddhesh ~]# ps -u postfixShows processes owned by a specific user. 5. Display Process with a Custom Output Format:
[root@siddhesh ~]# ps -eo pid,uid,ppid,command,nice,%mem,%cpuCustomizes the output to display specific information such as PID, command, CPU usage, and memory usage.
6. Sort Processes by Usage:
[root@siddhesh ~]# ps aux --sort=%cpu[root@siddhesh ~]# ps aux --sort=-%memSorts processes by CPU/Mem usage, with the highest usage at the top.
7. Display Process with Full Command Line:
[root@siddhesh ~]# ps auxwwShows the full command line and prevents truncation.
8. Display Process with a Specific Command:
[root@siddhesh ~]# ps -C mysqldDisplays processes that match a specific command name.
Linux Process Management Through top :
The top command in Linux is an interactive, real-time system monitoring tool that provides a dynamic, live view of the system's processes. It displays information about system resource usage, running processes, and other system statistics. While top is running, you can use various commands to interact with and control its display. Here are some common commands you can use when top is running:
1.Sorting: A. Press P to sort the process list by CPU usage.
B. Press M to sort the process list by memory usage. C. Press T to sort the process list by Time. D. Press N to sort the process list by PID.
2. Exit After Repetition:
[root@siddhesh ~]# top -n 2top command will exit automatically after 2 refreshes.
3. Filter Processes by Specific User
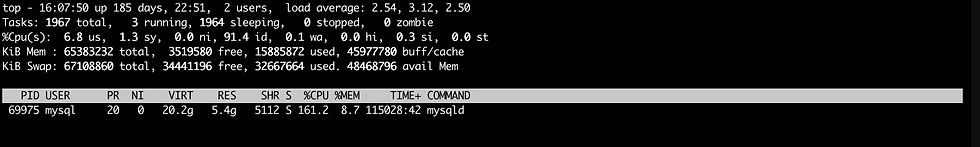
[root@siddhesh ~]# top -u mysqlThe output will show details such as CPU usage, memory usage, and other relevant statistics for processes associated with the MySQL user.
4. Display Units Use the E key to choose the units you want top to use for displaying the memory values. In MB:

In GB:

5. CPU Graph & Details
Pressing 1 on your keyboard allows you to see individual statistics for each CPU core. Press 1 repeatedly to toggle core statistics.

Top offers simple ASCII graphs that indicate each CPU core usage if you want a graphical depiction of CPU use. Toggle the graphs on or off by pressing t.

6. Memory Usage Graph
Press m to get a visual representation of your memory consumption. Press m again to remove the lines.

7. Change Text Color
Press the z key to add color to the display. Open the color settings page by pressing Z.

8. Show Full Command Line
Press the c key to show the whole command line rather than the process name. To return to viewing the process name, hit c once more.

9. Process Hierarchy Press the V key to view which processes were initiated or generated by other processes.

10. Active Task Press the I key to filter the output and display only active tasks.

11. Filter The top filter allows you to limit which processes appear in the list by applying a filter expression. You can enable the filter option by pressing the o key.
Filter example : %CPU>100.0
Linux Process Management Through /proc :
The /proc directory in Linux contains a virtual filesystem that exposes information about the kernel, processes, and other system-related information. Inside the /proc directory, each running process has its own subdirectory named with its Process ID (PID). For example, /proc/1234 would correspond to the process with PID 1234. The contents of /proc/<pid> provide detailed information about the corresponding process. Below are some of the key files and directories within /proc/<pid>:
1. cmdline Contains the command-line arguments passed to the process.
[root@siddhesh ~]# cat /proc/25240/cmdline
nginx: master process nginx -g daemon off;
[root@siddhesh ~]#
2. cwd
A symbolic link to the current working directory of the process.
[root@siddhesh ~]# ls -l /proc/25240/cwd
lrwxrwxrwx 1 root root 0 Dec  6 16:57 /proc/25240/cwd -> /
[root@siddhesh ~]#
/proc/25240/cwd -> /: This is the symbolic link itself. It tells you that the current working directory of the process with PID 25240 is the root directory ("/").
3. environ Contains the environment variables of the process.
[root@siddhesh ~]# cat /proc/25240/environ
 nginx -g daemon off;
[root@siddhesh ~]#
4. exe
A symbolic link to the executable file being run by the process.
[root@siddhesh ~]# ll /proc/25240/exe
lrwxrwxrwx 1 root root 0 Nov 25 16:47 /proc/25240/exe -> /usr/sbin/nginx
[root@siddhesh ~]#
/proc/25240/exe -> /usr/sbin/nginx: This is the symbolic link itself. It tells you that the executable file of the process with PID 25240 is located at /usr/sbin/nginx.
5. fd A directory containing symbolic links to all open file descriptors.
[root@siddhesh ~]# ll /proc/25240/fd
total 0
lrwx------ 1 root root 64 Nov 25 16:47 0 -> /1
lrwx------ 1 root root 64 Nov 25 16:47 1 -> /1
lrwx------ 1 root root 64 Nov 25 16:47 10 -> socket:[5043141]
lrwx------ 1 root root 64 Nov 25 16:47 11 -> socket:[5043142]
lrwx------ 1 root root 64 Nov 25 16:47 12 -> socket:[5043143]
lrwx------ 1 root root 64 Nov 25 16:47 13 -> socket:[5043144]
l-wx------ 1 root root 64 Nov 25 16:47 2 -> /1
lrwx------ 1 root root 64 Nov 25 16:47 3 -> socket:[5043137]
lrwx------ 1 root root 64 Nov 25 16:47 9 -> socket:[5043140]
[root@siddhesh ~]#
6. stat
[root@siddhesh ~]# cat /proc/25240/stat
25240 (nginx) S 25220 25240 25240 34817 25240 4202752 2475 1036 0 0 5 1 0 0 20 0 1 0 233559666 11649024 1103 18446744073709551615 93903133970432 93903135115733 140732479696080 140732479694728 140006705259093 0 0 1073745920 402745863 18446744072565248380 0 0 17 3 0 0 0 0 0 93903135377136 93903135509152 93903141949440 140732479700769 140732479700790 140732479700790 140732479700968 0
[root@siddhesh ~]#
The command cat /proc/25240/stat is used to display information about the status and statistics of a specific process with Process ID (PID) 25240.
7. limits
Displays resource limits for the process.
[root@siddhesh ~]# cat /proc/25240/limits
Limit                     Soft Limit           Hard Limit           Units
Max cpu time              unlimited            unlimited            seconds
Max file size             unlimited            unlimited            bytes
Max data size             unlimited            unlimited            bytes
Max stack size            8388608              unlimited            bytes
Max core file size        unlimited            unlimited            bytes
Max resident set          unlimited            unlimited            bytes
Max processes             1048576              1048576              processes
Max open files            1048576              1048576              files
Max locked memory         65536                65536                bytes
Max address space         unlimited            unlimited            bytes
Max file locks            unlimited            unlimited            locks
Max pending signals       62596                62596                signals
Max msgqueue size         819200               819200               bytes
Max nice priority         0                    0
Max realtime priority     0                    0
Max realtime timeout      unlimited            unlimited            us
[root@siddhesh ~]#
8. io
Contains I/O statistics for the process, such as the number of read and write operations.
[root@siddhesh ~]# cat /proc/25240/io
rchar: 94716
wchar: 1715
syscr: 348
syscw: 24
read_bytes: 0
write_bytes: 4096
cancelled_write_bytes: 0
[root@siddhesh ~]#
Where,
rchar (Read Characters): 94716
This counter represents the total number of characters that the process has read from storage.
wchar (Write Characters): 1715
This counter represents the total number of characters that the process has written to storage.
syscr (System Calls - Read): 348
This counter represents the total number of read system calls that the process has made.
syscw (System Calls - Write): 24
This counter represents the total number of write system calls that the process has made.
read_bytes: 0
This counter represents the total number of bytes that the process has read from storage. In this case, it's 0, indicating that there haven't been any actual read operations.
write_bytes: 4096
This counter represents the total number of bytes that the process has written to storage. In this case, it's 4096 bytes.
cancelled_write_bytes: 0
This counter represents the total number of bytes that were intended to be written but were cancelled. In this case, it's 0, indicating that there haven't been any cancelled write operations.


Comments